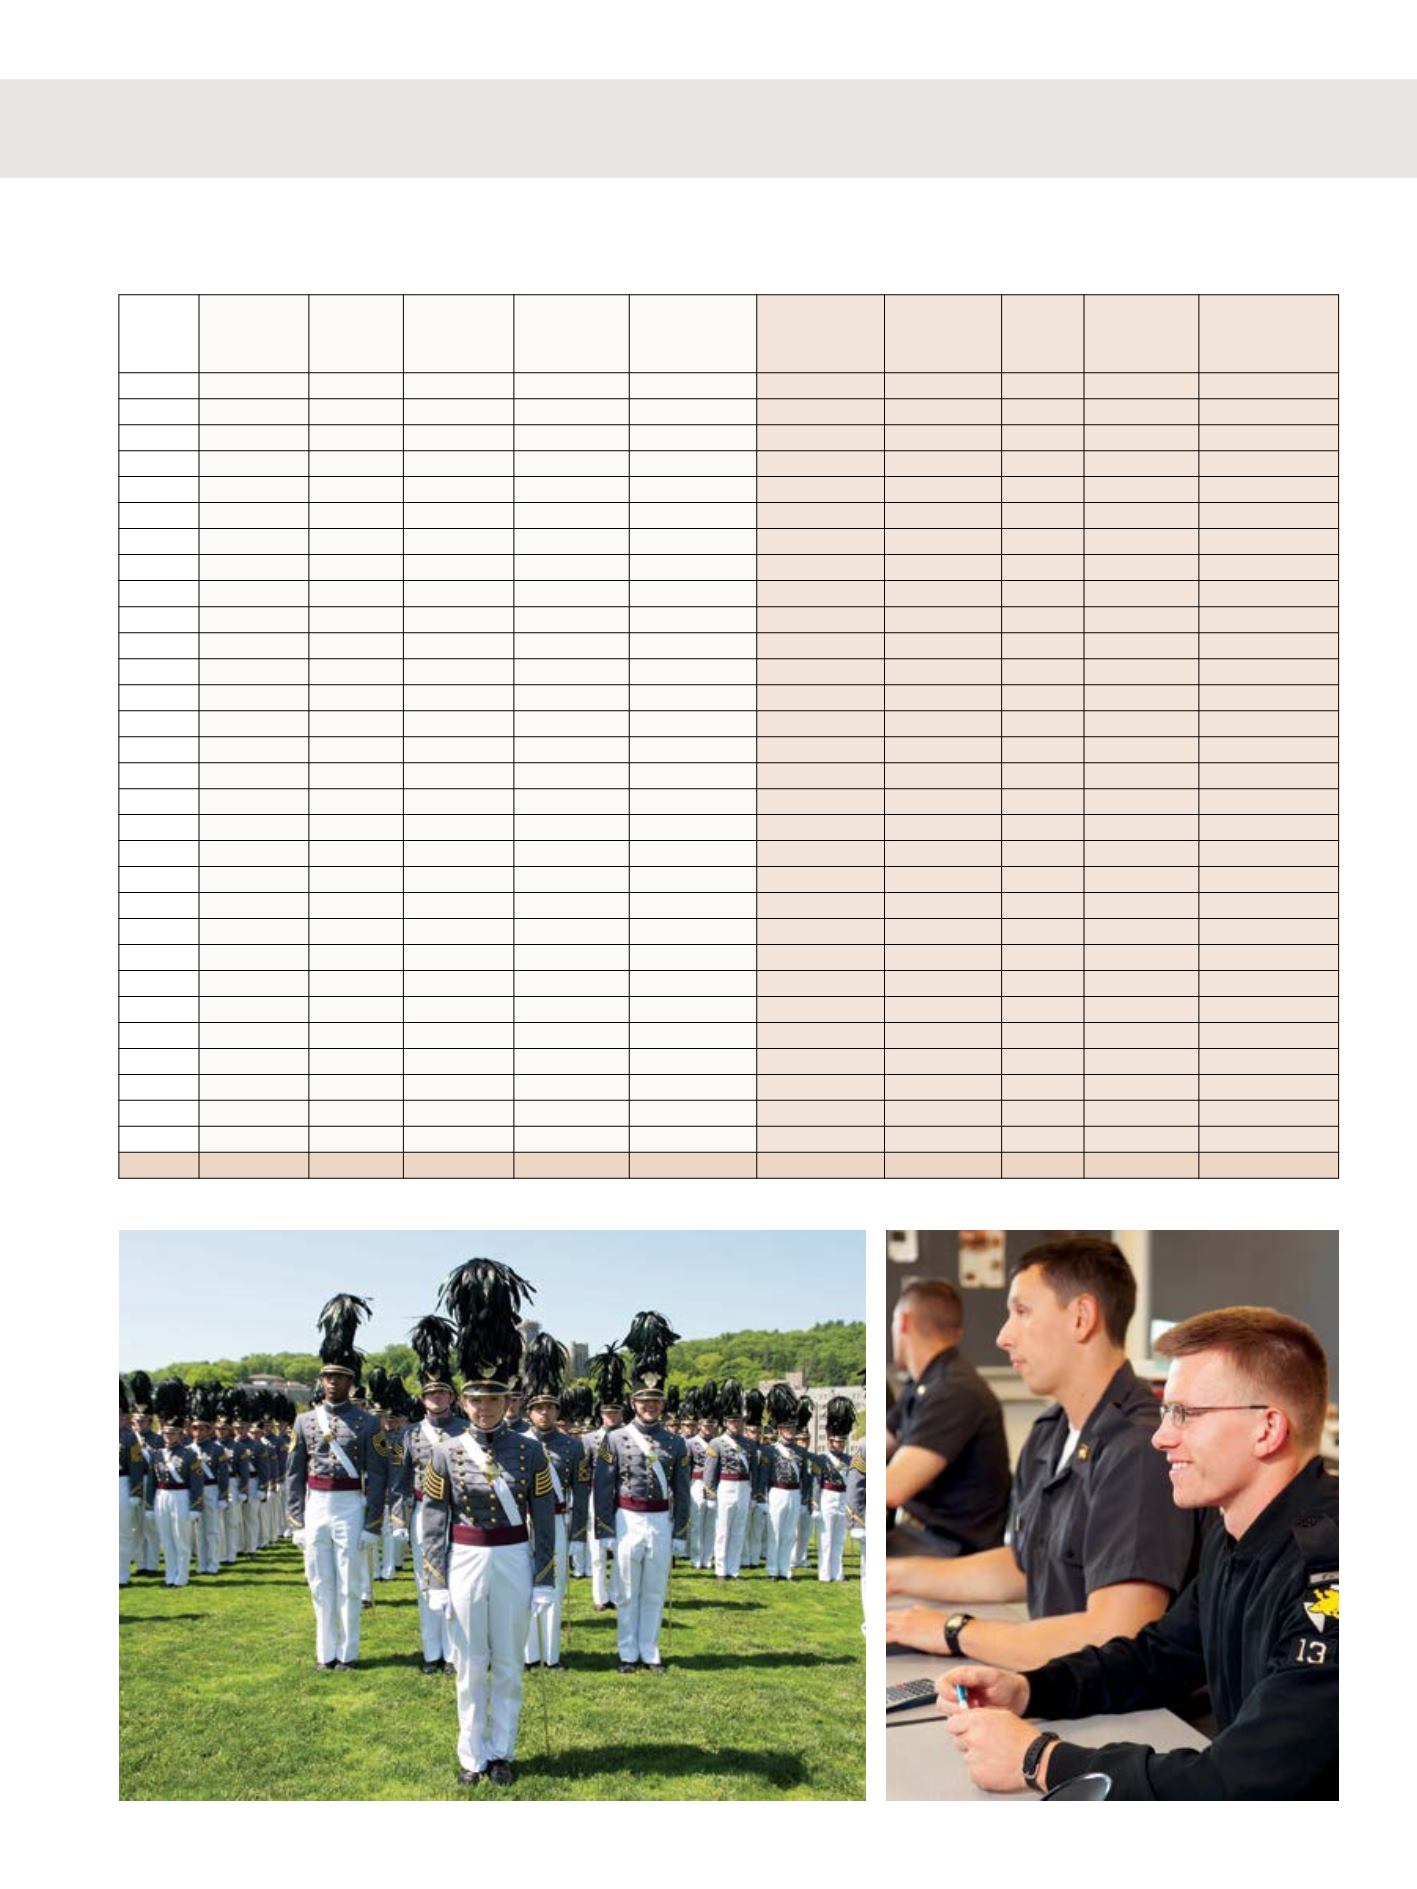

2015 alumni Giving by class
Includes donations by Alumni to all Academy funds in 2015*
lifetime giving by class
Includes donations by Alumni to all Academy funds since graduation through 2015*
Class of total given
Number of
living
constitu-
ents
number of
donors
Includedarealsograd-
uatedonorswhodied
during2015
Percent of
Participation
average gift
per donor
total given
Number of
constituents
at graduation
number of
donors
Percent of
Participation
Average
lifetime giving
per donor
1986
$405,089.13
979
188
19%
$2,154.73
$3,896,981.89
1,006
705
70%
$5,527.63
1987
$349,841.01
1,029
268
26%
$1,305.38
$3,121,745.13
1,042
712
68%
$4,384.47
1988
$724,285.40
958
145
15%
$4,995.07
$3,089,636.38
981
686
70%
$4,503.84
1989
$1,243,197.34
1,050
153
15%
$8,125.47
$6,179,564.17
1,066
721
68%
$8,570.82
1990
$401,591.71
918
342
37%
$1,174.24
$1,874,223.56
931
673
72%
$2,784.88
1991
$575,855.91
945
254
27%
$2,267.15
$3,353,728.95
965
633
66%
$5,298.15
1992
$636,662.09
957
139
15%
$4,580.30
$2,424,425.28
962
589
61%
$4,116.17
1993
$85,746.69
1,010
163
16%
$526.05
$1,151,882.00
1,018
660
65%
$1,745.28
1994
$315,001.36
1,029
246
24%
$1,280.49
$1,432,822.47
1,046
724
69%
$1,979.04
1995
$327,090.84
1,007
361
36%
$906.07
$1,868,494.72
1,015
833
82%
$2,243.09
1996
$143,581.91
916
262
29%
$548.02
$883,471.90
925
584
63%
$1,512.79
1997
$128,510.31
903
260
29%
$494.27
$1,282,048.90
917
721
79%
$1,778.15
1998
$83,454.34
871
168
19%
$496.75
$630,550.56
883
540
61%
$1,167.69
1999
$101,989.80
939
257
27%
$396.85
$1,188,879.99
949
765
81%
$1,554.09
2000
$61,722.39
956
169
18%
$365.22
$595,929.63
965
567
59%
$1,051.02
2001
$50,668.55
921
193
21%
$262.53
$705,954.79
930
603
65%
$1,170.74
2002
$157,362.27
973
228
23%
$690.19
$921,916.83
989
689
70%
$1,338.05
2003
$41,061.98
872
230
26%
$178.53
$568,932.27
879
633
72%
$898.79
2004
$54,003.10
941
300
32%
$180.01
$686,548.92
955
771
81%
$890.47
2005
$70,276.64
924
306
33%
$229.66
$516,817.71
936
610
65%
$847.24
2006
$55,154.25
871
327
38%
$168.67
$670,237.43
876
625
71%
$1,072.38
2007
$52,814.22
997
290
29%
$182.12
$520,353.69
1,006
511
51%
$1,018.30
2008
$53,328.11
982
293
30%
$182.01
$418,001.19
988
463
47%
$902.81
2009
$67,602.03
988
461
47%
$146.64
$449,935.82
993
613
62%
$733.99
2010
$43,172.48
1,031
340
33%
$126.98
$256,949.40
1,037
406
39%
$632.88
2011
$44,155.25
1,067
328
31%
$134.62
$197,389.61
1,070
359
34%
$549.83
2012
$92,274.38
1,019
496
49%
$186.04
$325,988.68
1,021
525
51%
$620.93
2013
$120,934.80
1,049
412
39%
$293.53
$309,414.48
1,051
430
41%
$719.57
2014
$55,406.91
1,114
425
38%
$130.37
$112,650.28
1,114
431
39%
$261.37
2015
$39,899.17
1,035
404
39%
$98.76
$42,049.17
1,035
406
39%
$103.57
Total $32,671,536.12
51,165
15,697
31%
$2,081.39
$486,206,189.30
62,851
44,367
71%
$10,958.73
*Donations include gift types of Cash, Matching Gifts, Irrevocable Planned Gifts, and Gifts-in-Kind.
WestPointAOG.org41


